HolisticInfoSec's Russ McRee was pleased to be added to ISSA International's Honor Roll this month, a lifetime achievement award recognizing an individual's sustained contributions to the information security community, the advancement of the association and enhancement of the professionalism of the membership.
According to the press release:
"Russ McRee has a strong history in the information security as a teacher, practitioner and writer. He is responsible for 107 technical papers published in the ISSA Journal under his Toolsmith byline in 2006-2015. These articles represent a body of knowledge for the hands-on practitioner that is second to none. These titles span an extremely wide range of deep network security topics. Russ has been an invited speaker at the key international computer security venues including DEFCON, Derby Con, BlueHat, Black Hat, SANSFIRE, RSA, and ISSA International."
Russ greatly appreciates this honor and would like to extend congratulations to the ten other ISSA 2017 award winners. Sincere gratitude to Briana and Erin McRee, Irvalene Moni, Eric Griswold, Steve Lynch, and Thom Barrie for their extensive support over these many years.

Russ McRee's HolisticInfoSec™ includes articles and research, as well as feedback and an occasional rant. HolisticInfoSec™ promotes standards, simplicity, tooling and efficiency in achieving holistic information security.
Tuesday, October 17, 2017
toolsmith #128 - DFIR Redefined: Deeper Functionality for Investigators with R - Part 1
“To competently perform rectifying security service, two critical incident response elements are necessary: information and organization.” ~ Robert E. Davis
I've been presenting DFIR Redefined: Deeper Functionality for Investigators with R across the country at various conference venues and thought it would helpful to provide details for readers.
The basic premise?
Incident responders and investigators need all the help they can get.
Let me lay just a few statistics on you, from Secure360.org's The Challenges of Incident Response, Nov 2016. Per their respondents in a survey of security professionals:
The 2017 SANS Incident Response Survey, compiled by Matt Bromiley in June, reminds us that “2016 brought unprecedented events that impacted the cyber security industry, including a myriad of events that raised issues with multiple nation-state attackers, a tumultuous election and numerous government investigations.” Further, "seemingly continuous leaks and data dumps brought new concerns about malware, privacy and government overreach to the surface.”
Finally, the survey shows that IR teams are:
With R you can interface with data via file ingestion, database connection, APIs and benefit from a wide range of packages and strong community investment.
From the Win-Vector Blog, per John Mount “not all R users consider themselves to be expert programmers (many are happy calling themselves analysts). R is often used in collaborative projects where there are varying levels of programming expertise.”
I propose that this represents the vast majority of us, we're not expert programmers, data scientists, or statisticians. More likely, we're security analysts re-using code for our own purposes, be it red team or blue team. With a very few lines of R investigators might be more quickly able to reach conclusions.
All the code described in the post can be found on my GitHub.
Have you been pwned?
This scenario I covered in an earlier post, I'll refer you to Toolsmith Release Advisory: Steph Locke's HIBPwned R package.
Visualization for malicious Windows Event Id sequences
Taking related log data, parsing and counting it for visualization with R would look something like Figure 3.
A screen capture of the resulting sunburst also follows as Figure 4.
How do your potential attackers feel, or can you identify an attacker via sentiment analysis?
I've been presenting DFIR Redefined: Deeper Functionality for Investigators with R across the country at various conference venues and thought it would helpful to provide details for readers.
The basic premise?
Incident responders and investigators need all the help they can get.
Let me lay just a few statistics on you, from Secure360.org's The Challenges of Incident Response, Nov 2016. Per their respondents in a survey of security professionals:
- 38% reported an increase in the number of hours devoted to incident response
- 42% reported an increase in the volume of incident response data collected
- 39% indicated an increase in the volume of security alerts
The 2017 SANS Incident Response Survey, compiled by Matt Bromiley in June, reminds us that “2016 brought unprecedented events that impacted the cyber security industry, including a myriad of events that raised issues with multiple nation-state attackers, a tumultuous election and numerous government investigations.” Further, "seemingly continuous leaks and data dumps brought new concerns about malware, privacy and government overreach to the surface.”
Finally, the survey shows that IR teams are:
- Detecting the attackers faster than before, with a drastic improvement in dwell time
- Containing incidents more rapidly
- Relying more on in-house detection and remediation mechanisms
- Have you been pwned?
- Visualization for malicious Windows Event Id sequences
- How do your potential attackers feel, or can you identify an attacker via sentiment analysis?
- Fast Frugal Trees (decision trees) for prioritizing criticality
With R you can interface with data via file ingestion, database connection, APIs and benefit from a wide range of packages and strong community investment.
From the Win-Vector Blog, per John Mount “not all R users consider themselves to be expert programmers (many are happy calling themselves analysts). R is often used in collaborative projects where there are varying levels of programming expertise.”
I propose that this represents the vast majority of us, we're not expert programmers, data scientists, or statisticians. More likely, we're security analysts re-using code for our own purposes, be it red team or blue team. With a very few lines of R investigators might be more quickly able to reach conclusions.
All the code described in the post can be found on my GitHub.
Have you been pwned?
This scenario I covered in an earlier post, I'll refer you to Toolsmith Release Advisory: Steph Locke's HIBPwned R package.
Visualization for malicious Windows Event Id sequences
Windows Events by Event ID present excellent sequenced visualization opportunities. A hypothetical scenario for this visualization might include multiple failed logon attempts (4625) followed by a successful logon (4624), then various malicious sequences. A fantastic reference paper built on these principle is Intrusion Detection Using Indicators of Compromise Based on Best Practices and Windows Event Logs. An additional opportunity for such sequence visualization includes Windows processes by parent/children. One R library particularly well suited to is TraMineR: Trajectory Miner for R. This package is for mining, describing and visualizing sequences of states or events, and more generally discrete sequence data. It's primary aim is the analysis of biographical longitudinal data in the social sciences, such as data describing careers or family trajectories, and a BUNCH of other categorical sequence data. Somehow though, the project page somehow fails to mention malicious Windows Event ID sequences. :-) Consider Figures 1 and 2 as retrieved from above mentioned paper. Figure 1 are text sequence descriptions, followed by their related Windows Event IDs in Figure 2.
 |
| Figure 1 |
 |
| Figure 2 |
 |
| Figure 3 |
How much R code does it take to visualize this data with a beautiful, interactive sunburst visualization? Three lines, not counting white space and comments, as seen in the video below.
A screen capture of the resulting sunburst also follows as Figure 4.
 |
| Figure 4 |
How do your potential attackers feel, or can you identify an attacker via sentiment analysis?
Do certain adversaries or adversarial communities use social media? Yes
As such, can social media serve as an early warning system, if not an actual sensor? Yes
Are certain adversaries, at times, so unaware of OpSec on social media that you can actually locate them or correlate against other geo data? Yes
Some excellent R code to assess Twitter data with includes Jeff Gentry's twitteR and rtweet to interface with the Twitter API.
- twitteR: provides access to the Twitter API. Most functionality of the API is supported, with a bias towards API calls that are more useful in data analysis as opposed to daily interaction.
- Rtweet: R client for interacting with Twitter’s REST and stream API’s.
The code and concepts here are drawn directly from Michael Levy, PhD UC Davis: Playing With Twitter.
Here's the scenario: DDoS attacks from hacktivist or chaos groups.
Attacker groups often use associated hashtags and handles and the minions that want to be "part of" often retweet and use the hashtag(s). Individual attackers either freely give themselves away, or often become easily identifiable or associated, via Twitter. As such, here's a walk-through of analysis techniques that may help identify or better understand the motives of certain adversaries and adversary groups. I don't use actual adversary handles here, for obvious reasons. I instead used a DDoS news cycle and journalist/bloggers handles as exemplars. For this example I followed the trail of the WireX botnet, comprised mainly of Android mobile devices utilized to launch a high-impact DDoS extortion campaign against multiple organizations in the travel and hospitality sector in August 2017. I started with three related hashtags:
- #DDOS
- #Android
- #WireX
We start with all related Tweets by day and time of day. The code is succinct and efficient, as noted in Figure 5.
The result is a pair of graphs color coded by tweets and retweets per Figure 6.
This gives you an immediate feels for spikes in interest by day as well as time of day, particularly with attention to retweets.
 |
| Figure 5 |
 |
| Figure 6 |
This gives you an immediate feels for spikes in interest by day as well as time of day, particularly with attention to retweets.
Want to see what platforms potential adversaries might be tweeting from? No problem, code in Figure 7.
The result in the scenario ironically indicates that the majority of related tweets using our hashtags of interest are coming from Androids per Figure 8. :-)
 |
| Figure 7 |
The result in the scenario ironically indicates that the majority of related tweets using our hashtags of interest are coming from Androids per Figure 8. :-)
 |
| Figure 8 |
Now to the analysis of emotional valence, or the "the intrinsic attractiveness (positive valence) or averseness (negative valence) of an event, object, or situation."
orig$text[which.max(orig$emotionalValence)] tells us that the most positive tweet is "A bunch of Internet tech companies had to work together to clean up #WireX #Android #DDoS #botnet."
orig$text[which.min(orig$emotionalValence)] tells us that "Dangerous #WireX #Android #DDoS #Botnet Killed by #SecurityGiants" is the most negative tweet.
Interesting right? Almost exactly the same message, but very different valence.
How do we measure emotional valence changes over the day? Four lines later...
filter(orig, mday(created) == 29) %>%
ggplot(aes(created, emotionalValence)) +
geom_point() +
geom_smooth(span = .5)
...and we have Figure 9, which tell us that most tweets about WireX were emotionally neutral on 29 AUG 2017, around 0800 we saw one positive tweet, a more negative tweets overall in the morning.
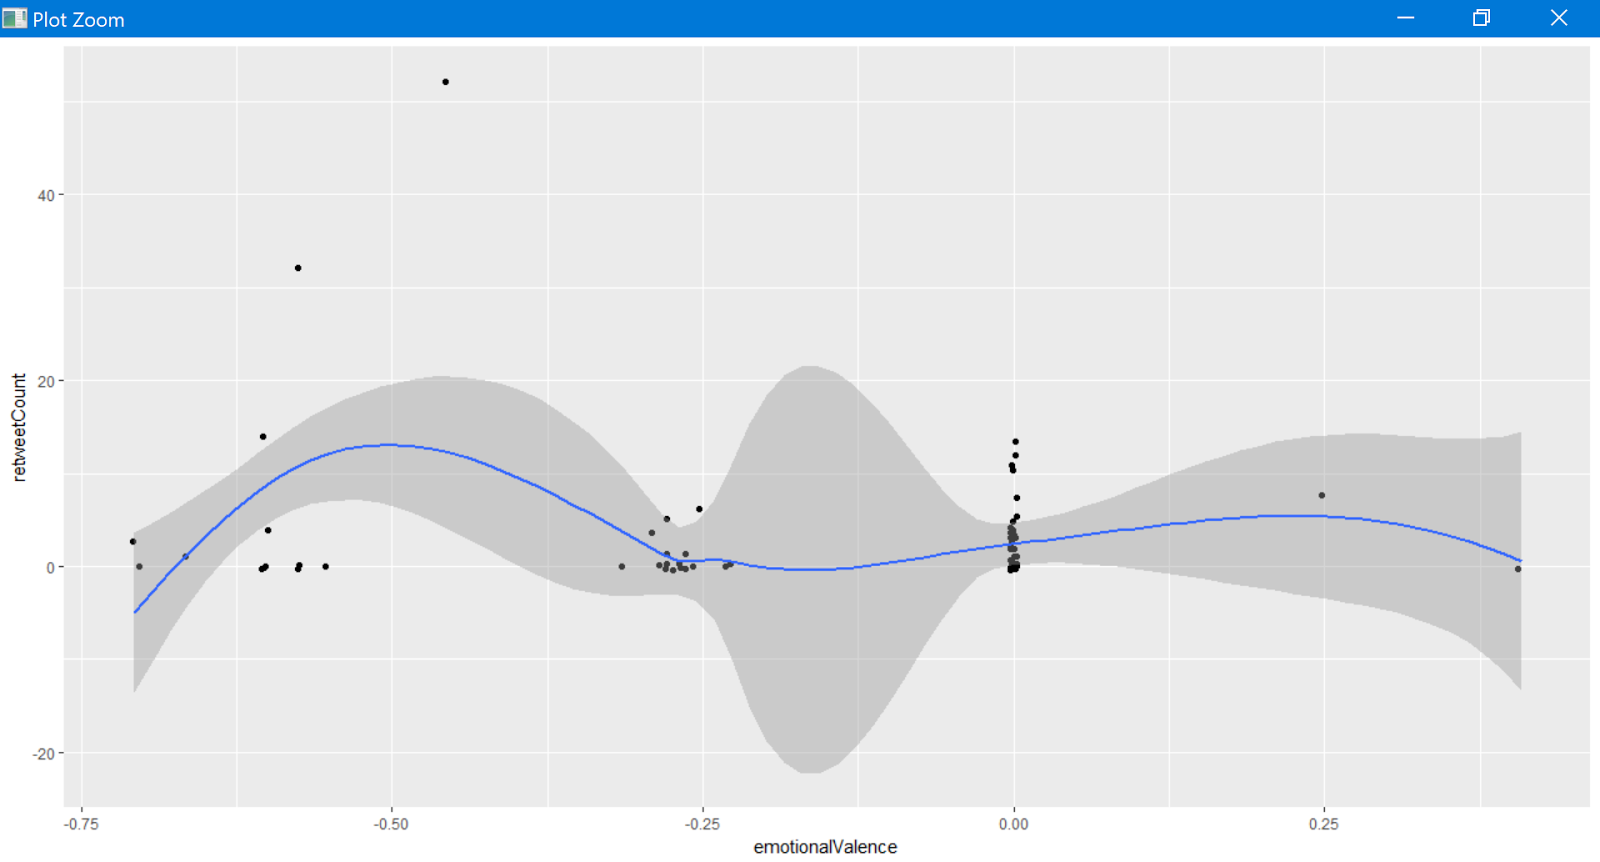
Another line of questioning to consider: which tweets are more often retweeted, positive or negative? As you can imagine with information security focused topics, negativity wins the day.
Three lines of R...
ggplot(orig, aes(x = emotionalValence, y = retweetCount)) +
geom_point(position = 'jitter') +
geom_smooth()
...and we learn just how popular negative tweets are in Figure 10.
There are cluster of emotionally neutral retweets, two positive retweets, and a load of negative retweets. This type of analysis can quickly lead to a good feel for the overall sentiment of an attacker collective, particularly one with less opsec and more desire for attention via social media.
In Part 2 of DFIR Redefined: Deeper Functionality for Investigators with R we'll explore this scenario further via sentiment analysis and Twitter data, as well as Fast Frugal Trees (decision trees) for prioritizing criticality.
Let me know if you have any questions on the first part of this series via @holisticinfosec or russ at holisticinfosec dot org.
Cheers...until next time.
 |
| Figure 9 |
Three lines of R...
ggplot(orig, aes(x = emotionalValence, y = retweetCount)) +
geom_point(position = 'jitter') +
geom_smooth()
...and we learn just how popular negative tweets are in Figure 10.
 |
| Figure 10 |
In Part 2 of DFIR Redefined: Deeper Functionality for Investigators with R we'll explore this scenario further via sentiment analysis and Twitter data, as well as Fast Frugal Trees (decision trees) for prioritizing criticality.
Let me know if you have any questions on the first part of this series via @holisticinfosec or russ at holisticinfosec dot org.
Cheers...until next time.
Subscribe to:
Posts (Atom)
-
 Continuing where we left off in The HELK vs APTSimulator - Part 1 , I will focus our attention on additional, useful HELK features to ...
 -
toolsmith and HolisticInfoSec have moved. I've decided to consolidate all content on one platform, namely an R markdown blogdown sit...
-
 Ladies and gentlemen, for our main attraction, I give you...The HELK vs APTSimulator, in a Death Battle! The late, great Randy "Macho...